LIVP PERFORMANCE
The performance spread sheet we developed for the phase
one testing of our 280 HP IO550 G LIV was modified to include the 310 HP,
TSIO 550 G. Following are some results for the effect of speed and weight on
climb performance and the effect of weight on cruise performance. This TSIO
spread sheet should give a good indication of the relative effects of weight and
IAS. However the absolute values of ROC and TAS apply only to our Four. Absolute values for other Fours would
require model tweaking based on a few test results.


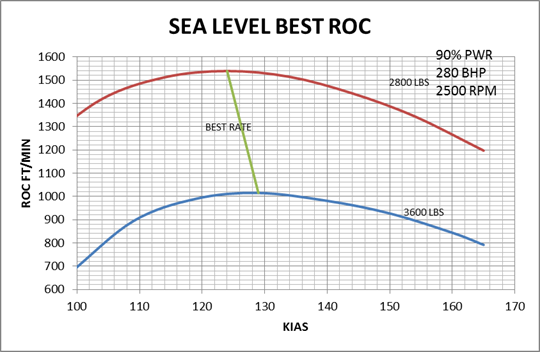
FIG 1 WEIGHT HAS A BIG
EFFECT ON BEST RATE OF CLIMB
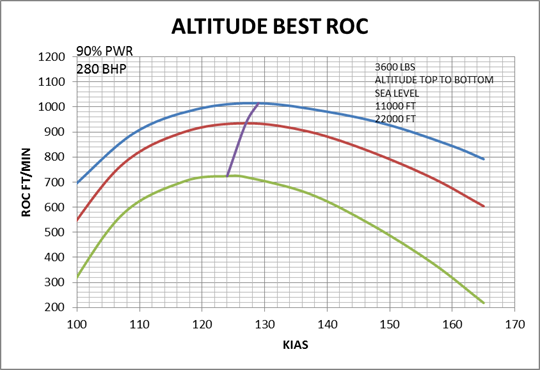
FIG 2 THE PENALITY FOR
EXCESSIVE CLIMB SPEED INCREASES WITH ALTITUDE
|
TABLE 1
CLIMB SEA-LEVEL TO 10000, 16000
AND 22000 FT ISA AT 2500 RPM AND 3600 LBS |
|
% PWR* |
MAP IN |
KIAS |
MIXTURE |
TO 10000 FT |
TO 16000 FT |
T0 22000 FT |
|
|
MIN |
GAL |
MIN |
GAL |
MIN |
GAL |
|
85 |
30.5 |
135 |
BEST POWER |
11.8 |
3.8 |
20.0 |
6.4 |
29.4 |
9.3 |
|
90 |
34 WOT |
135 |
FULL RICH |
10.3 |
4.9 |
17.1 |
8.0 |
25.1 |
11.2 |
|
85 |
30.5 |
165 |
BEST POWER |
17.2 |
5.6 |
31.8 |
10.2 |
62.1 |
19.5 |
FULL RICH AND WIDE OPEN THROTTLE (WOT) PROVIDES MINIMUM
CLIMB TIMES AND CLOSE TO MINIMUM FUEL BURN.
|
TABLE 2
CRUISE AT 3600 LBS, 75% PWR*,
28.5” MAP, 2400 RPM |
|
ISA ALT FT |
BHP |
BEST POWER GPH |
KTAS |
NM/GAL |
|
10000 |
229 |
16.9 |
210 |
12.4 |
|
16000 |
224 |
16.5 |
219 |
13.3 |
|
22000 |
217 |
16.0 |
226 |
14.1 |
SPEED AND RANGE IMPROVE WITH ALTITUDE AND WEIGHT
REDUCTION
|
TABLR 3
CRUISE AT 75% PWR*, 16000 FT,
28.5” MAP, 2400 RPM, 224 BHP, BP (16.5 GPH) |
|
WEIGHT LB |
10000 FT, 16.9
GPH |
16000 FT, 16.5
GPH |
22000 FT, 16.0
GPH |
|
|
KTAS |
NM/GAL |
KTAS |
NM/GAL |
KTAS |
NM/GAL |
|
2800 |
218 |
12.9 |
228 |
13.8 |
238 |
14.9 |
|
3200 |
214 |
12.7 |
224 |
13.6 |
232 |
14.5 |
|
3600 |
210 |
12.4 |
219 |
13.3 |
226 |
14.1 |
·
Sea level
power